
CEC Datasets & Interactive Visualizations
CEC Datasets & Interactive Visualizations
CEC Dataset
- Compiled data sourced from the CEDEN, WQP, EDT, CIWQS, and GeoTracker databases.
- Assembled as part of the Aquatic Science Center Data Synthesis Project. Further details on the process.
- Refined and trimmed for the SCCWRP Aquatic Ecosystems Expert Panel. Further details on the process of curating the dataset are available in the Draft Final California Aquatic Ecosystems CEC Expert Panel Report.
The CEC Program is developing a Data Management Plan which will document the CEC Program approach to managing data including the process and timing of future updates to this CECs dataset.
To access a copy of the CECs dataset including all available metadata, contact the CECs Program at DWQ-emergingcontaminants@waterboards.ca.gov.
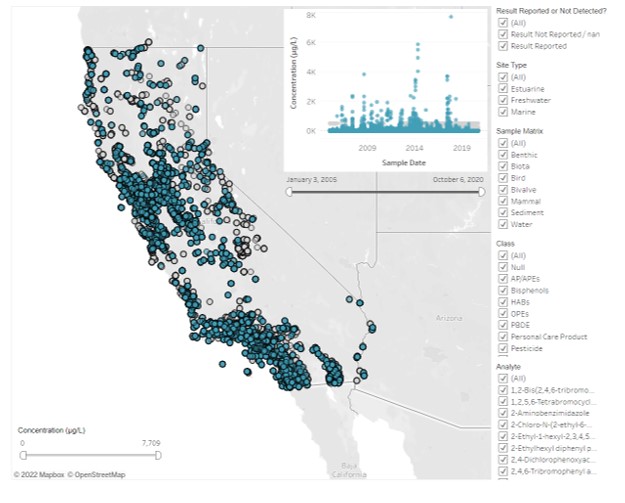
The Tableau Interactive Visualization is a draft tool to enable intuitive exploration of the CEC dataset by stakeholders and the public. Data can be filtered by detect/non-detect, Site Type, Sample Matrix, Class, and Analyte, and can be explored spatially and temporally.
Subscribe to our Emerging Contaminants email list to receive notifications and the latest updates.
Check your email account for a confirmation email to complete your subscription.
Subscribe to our other email lists. See the "Water Quality" section.
Quick Links
Contact Us
If you have questions about our program, please email us at:
