Underground Storage Tank Red Tag Requirements and Guidance
Red Tag Code and Regulations
The California Health and Safety Code, chapter 6.7, section 25292.3 permits the local implementing agencies and the State Water Resources Control Board (State Water Board) to affix red tags to any hazardous substance underground storage tank (UST) system. This law also permits the State Water Board or local implementing agency to issue a written directive to empty the noncompliant UST system as soon as possible, but no later than 48 hours after receiving the directive. An action taken by the State Water Board will be taken in consultation with the local implementing agency.
In addition, existing laws prohibits deposit of petroleum into a red tagged UST system. Delivery, deposit, and input of hazardous substances into and withdrawn of stored substance from a red tagged UST system is prohibited, except to empty the UST system at the direction of the State Water Board or local implementing agency.
USTs determined to have a significant violation that poses an imminent threat to health, safety of the environment may have a red tag affix preventing that UST system from either accepting fuel deliveries or dispensing fuel.
There are three categories of significant violation, as defined California Code of Regulations, title 23, division 3, chapter 16, section 2717:
- A violation causing or threatening to cause a release to the environment
- A violation that impairs the leak detection system
- A chronic violation committed by a recalcitrant violator
The State Water Board has provided instructions for affixing and removing red tags, with photographs of fill riser bag and red tag installation. The State Water Board provided guidance on the changes to the red tag code in a letter to stakeholders.
Red Tag Data
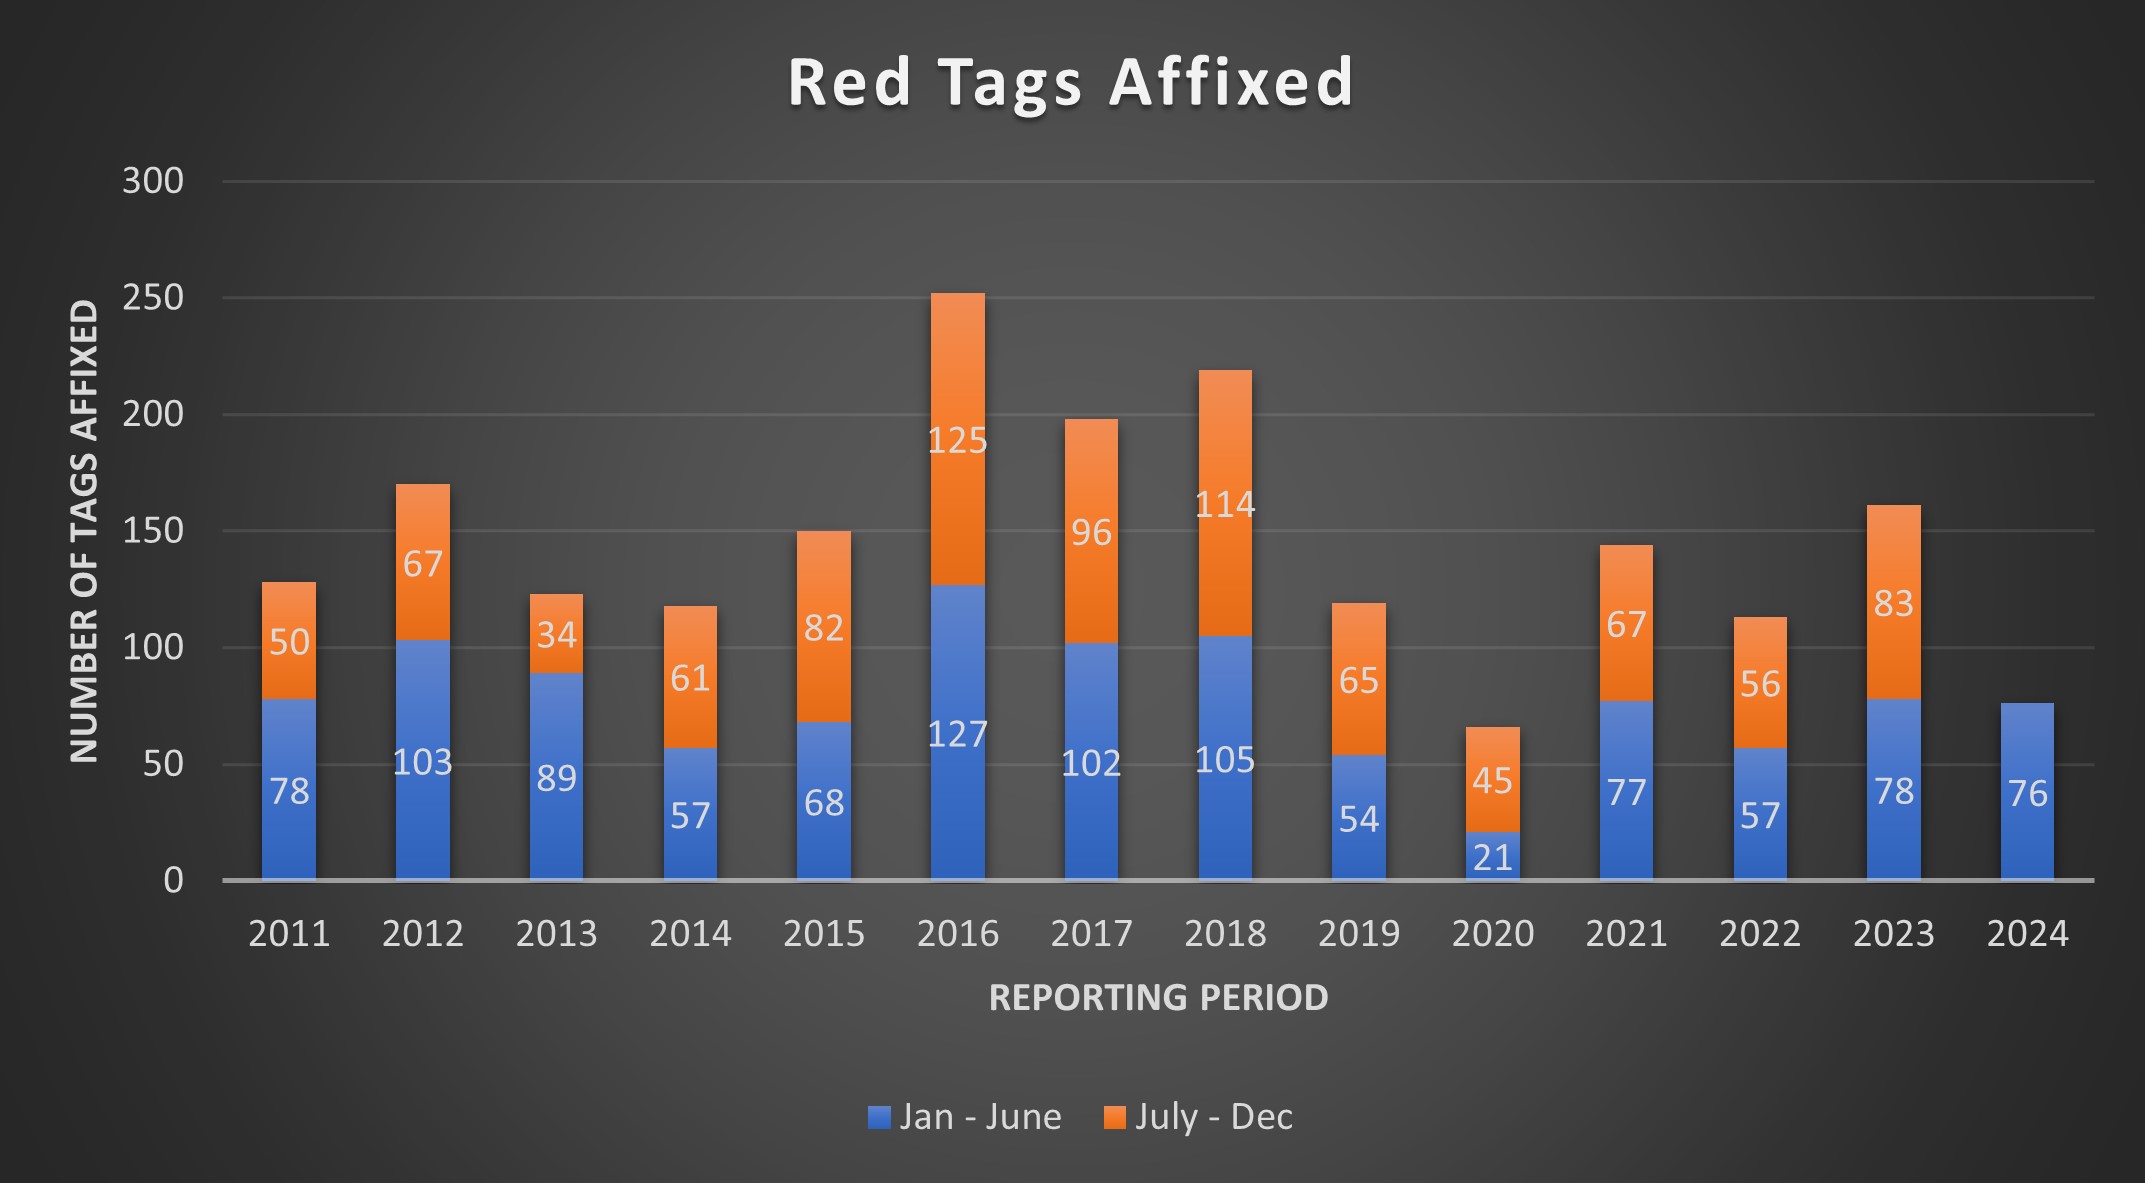
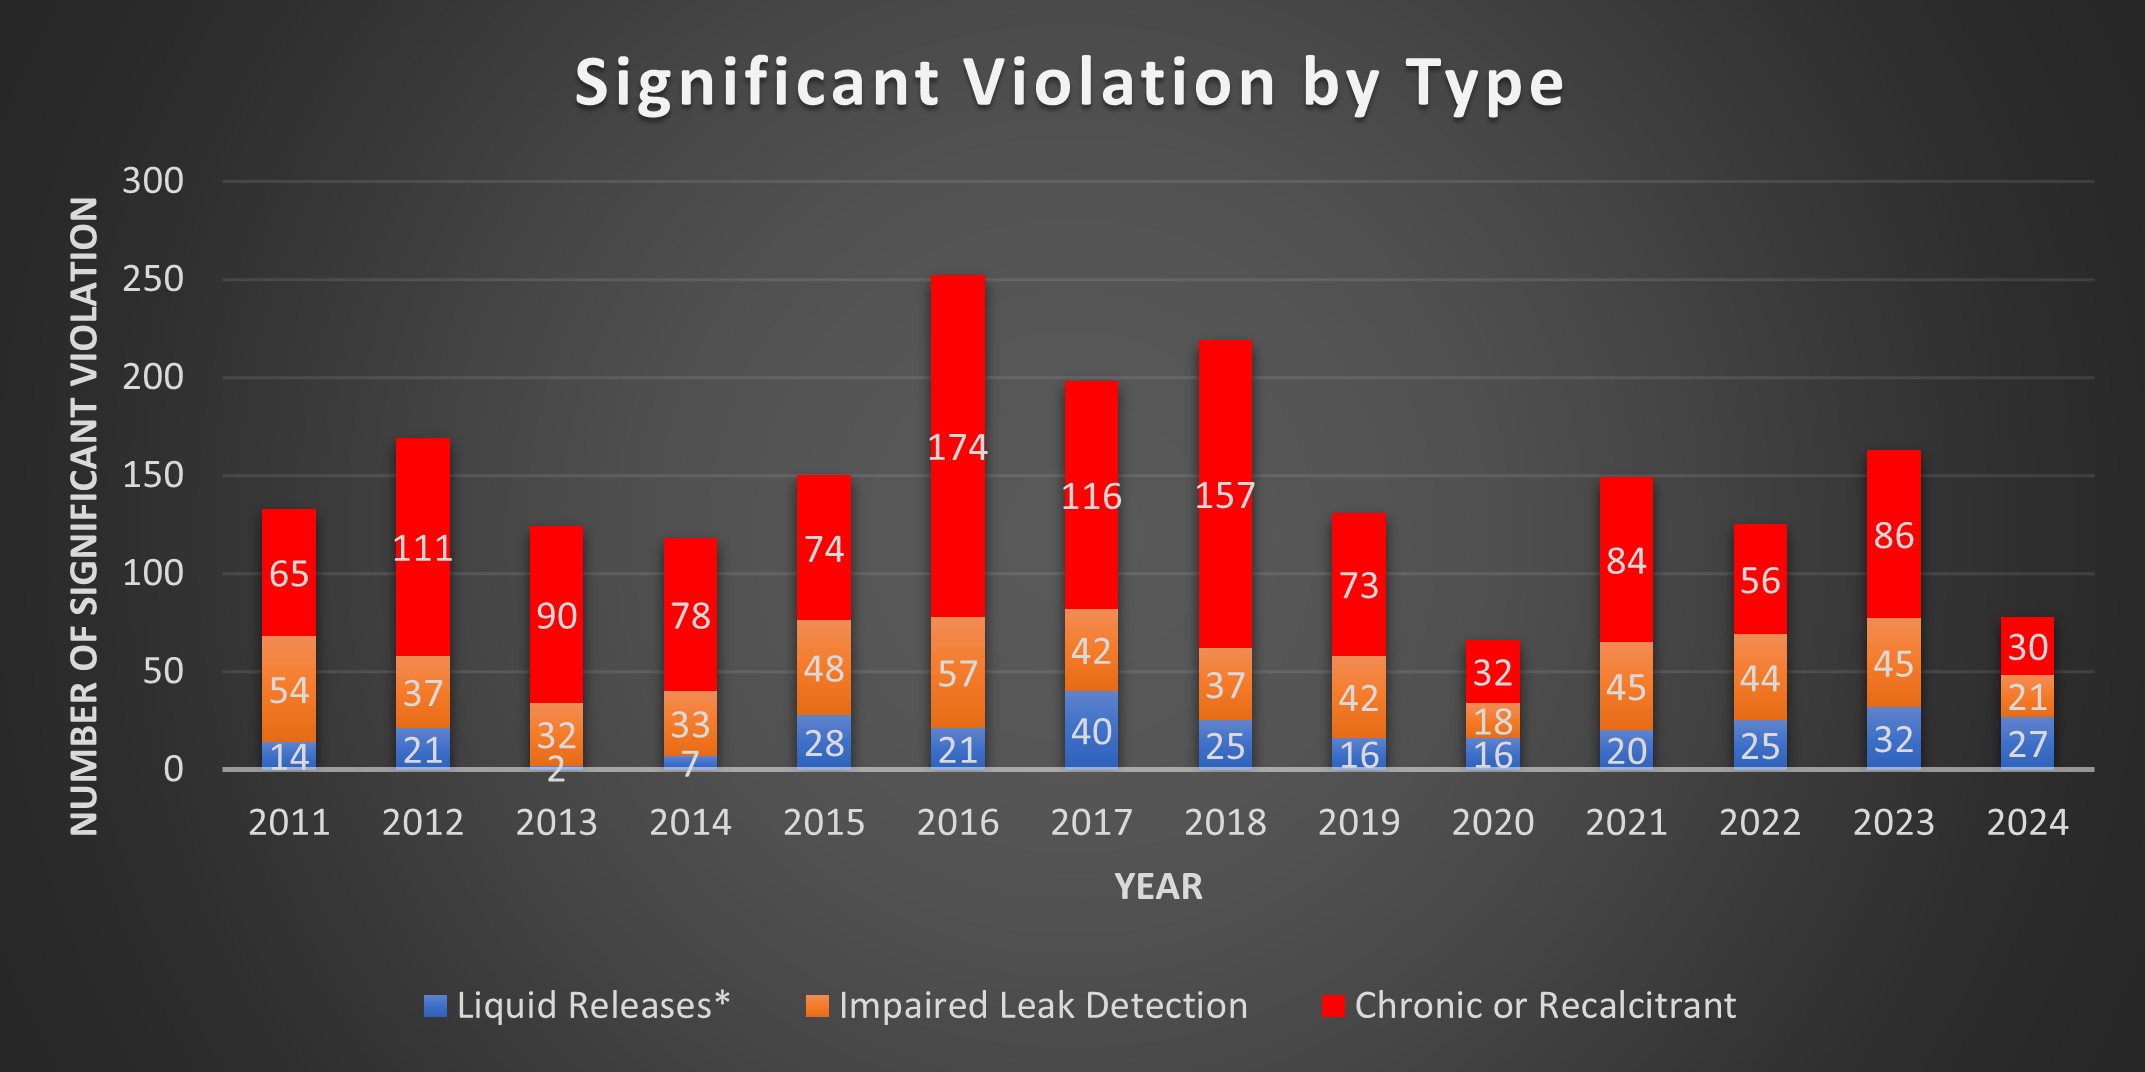
The State Water Board has provided graphic summaries of the total number of red tags affixed by year and a breakdown of the significant violation types. Red tag information is prepared biannually by local implementing agencies and reported to the State Water Board each March and September.
Red Tags Affixed by Year (2011-2025)
| Year | Jan - Jun | Jul - Dec | Annual Total |
|---|---|---|---|
| 2011 | 78 | 50 | 128 |
| 2012 | 103 | 67 | 170 |
| 2013 | 89 | 34 | 123 |
| 2014 | 57 | 61 | 118 |
| 2015 | 68 | 82 | 150 |
| 2016 | 127 | 125 | 252 |
| 2017 | 102 | 96 | 198 |
| 2018 | 105 | 114 | 219 |
| 2019 | 54 | 65 | 119 |
| 2020 | 21 | 45 | 66 |
| 2021 | 77 | 67 | 144 |
| 2022 | 57 | 56 | 113 |
| 2023 | 78 | 83 | 161 |
| 2024 | 83 | 112 | 195 |
| 2025 | 127 | 127 |

Significant Violations by Type (2011-2025)
| Year | Liquid Release* | Impaired Leak Detection | Chronic or Recalcitrant |
|---|---|---|---|
| 2011 | 14 | 54 | 65 |
| 2012 | 21 | 37 | 111 |
| 2013 | 2 | 32 | 90 |
| 2014 | 7 | 33 | 78 |
| 2015 | 28 | 48 | 74 |
| 2016 | 21 | 57 | 174 |
| 2017 | 40 | 42 | 116 |
| 2018 | 25 | 37 | 157 |
| 2019 | 16 | 42 | 73 |
| 2020 | 16 | 18 | 32 |
| 2021 | 20 | 45 | 84 |
| 2022 | 25 | 44 | 56 |
| 2023 | 32 | 45 | 86 |
| 2024 | 56 | 56 | 83 |
| 2025 | 33 | 33 | 61 |

*Liquid release means a loss detected by the release detection system and/or captured by the secondary containment
For information about this page, please contact Tom Henderson or (916) 319-9128.


